
Measuring our footprint. Committing to reduce it.
Since 1981 we have made passive cold chain equipment at Kandla Special Economic Zone for immunisation programmes across India and in more than 95 export destinations. We have now measured our full carbon footprint, had it independently verified, and are preparing a science-based target to reduce it.
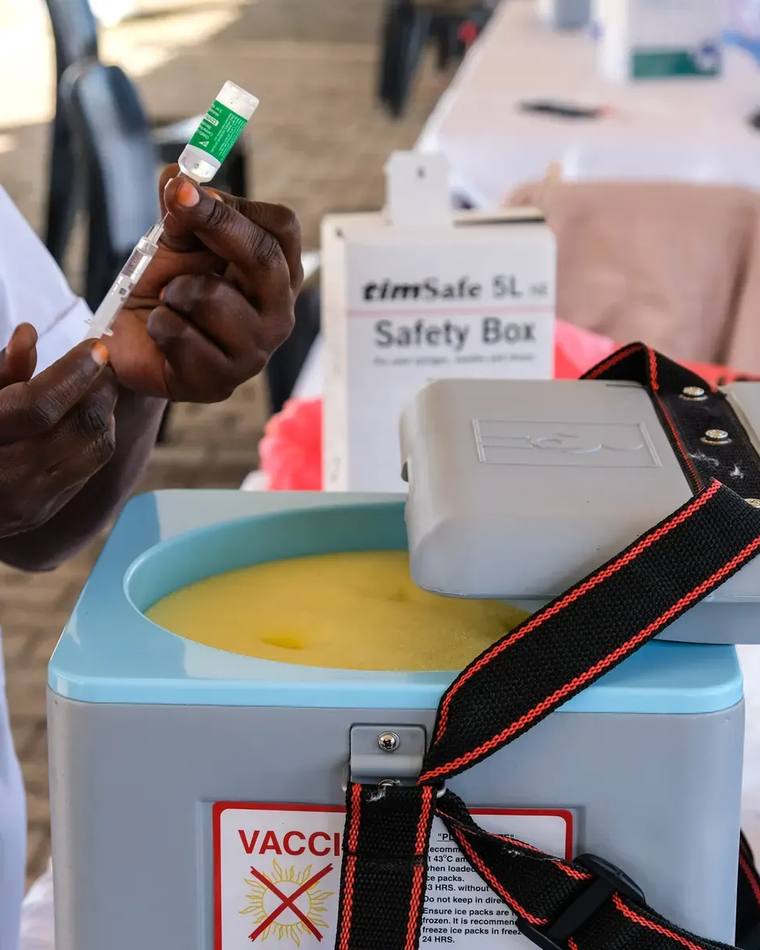
A Blow Kings vaccine carrier in use at an immunisation session.
Our base year, FY 2021-22
- Total footprint across Scopes 1, 2 and 3
- 2,833 tCO2e
- From our value chain (Scope 3)
- 87%
- Per tonne of product dispatched
- 2.79 tCO2e
- Independent verification of the inventory
- ISO 14064-3
1Part 1 of 2
Tracking our emissions
We follow the GHG Protocol and count emissions across our whole value chain: from the resin and foam chemicals we buy, through our plant, to the trucks, ships and aircraft that carry our products to immunisation programmes.
Where our emissions come from
Almost all of our footprint sits outside the factory gate. The plastics and foam chemicals that become our products account for 62% of it, freight for 17% and grid electricity for 13%. We reported no direct (Scope 1) emissions.1
- Scope 1, direct: nil
- Scope 2, purchased electricity: 375.6 t
- Scope 3, value chain: 2,457.8 t
-
62% from two materials
HDPE resin for our product shells and the polyol and MDI that form our foam insulation are energy-intensive petrochemicals.
-
Air freight: 4% of tonnage, 66% of freight emissions
33 tonnes of components flown in from the USA emitted 21 times more than 283 tonnes of resin shipped by sea.
-
One energy source inside the gate
525 MWh of grid electricity ran our moulding machines, foaming units, chillers and compressors. No diesel, LPG or company vehicles were reported.
Emission sources, FY 2021-22
tCO2e and share of total footprint, coloured by scope
- Scope 2
- Scope 3
The carbon is in the materials
Our products are mostly plastic and insulation by weight. Their cradle-to-gate footprint outweighs everything that happens inside our plant, which is why lower-carbon polymers and foam are central to our plan.
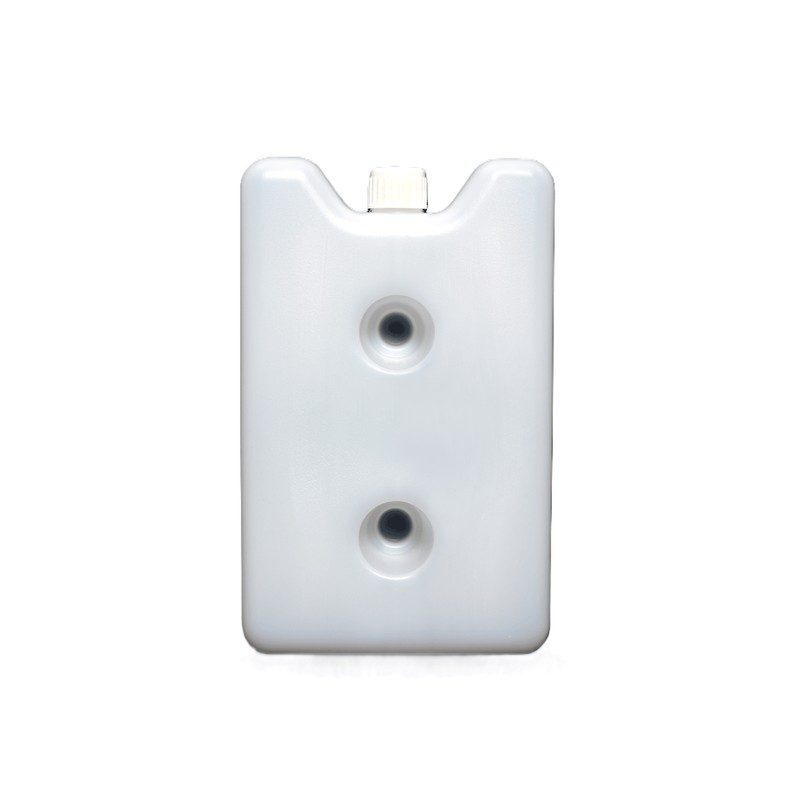 Ice packs
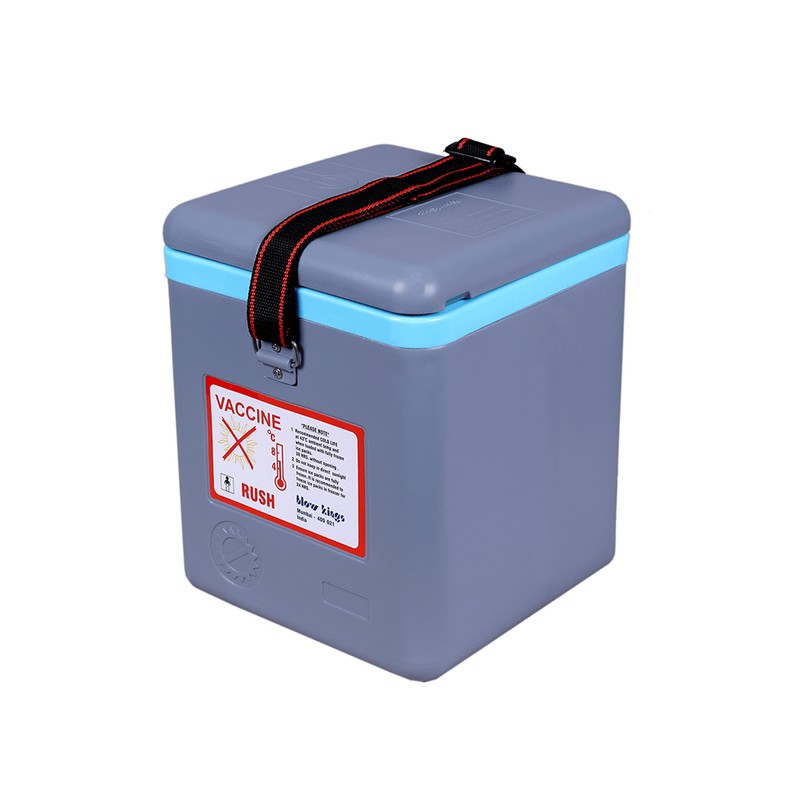 Vaccine carriers
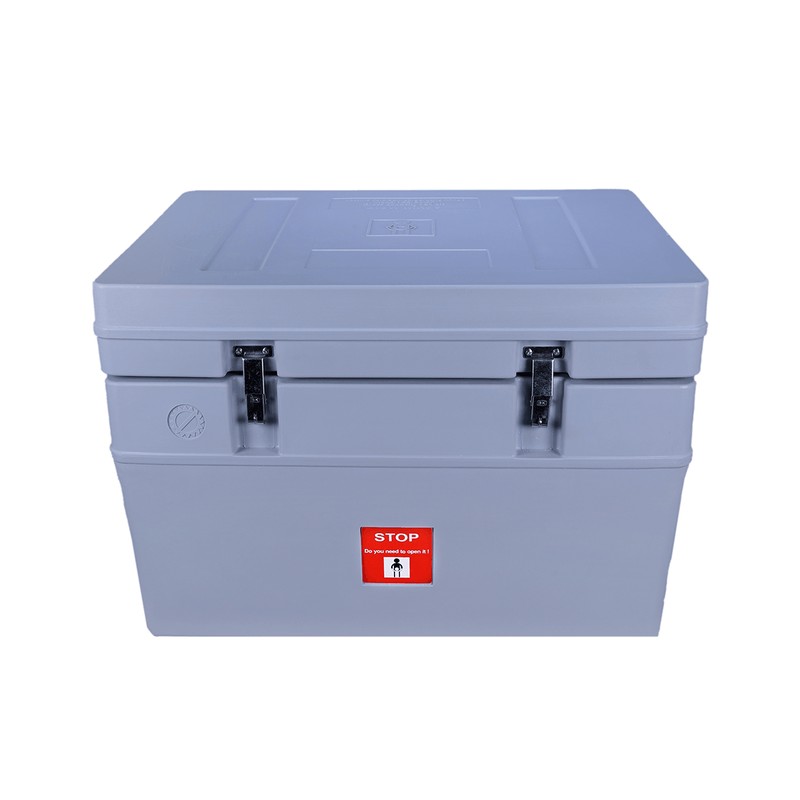 Cold boxes
How we measure
- Standard
- GHG Protocol Corporate Standard and Scope 3 Standard
- Boundary
- Operational control: our Kandla SEZ plant and Mumbai head office
- Coverage
- All 15 Scope 3 categories screened; 6 quantified, 3 awaiting data2
- Assurance
- Independently verified by an ISO 14064-3 auditor
Emission intensity lets us compare years as volumes change. Our baselines are 2.79 tCO2e and 517 kWh of grid electricity per tonne of product dispatched.
Grid electricity use by month, FY 2021-22
MWh; 525 MWh in total, our only operational energy source
Use follows production, from 79.7 MWh in April 2021 to 10.6 MWh in December.
Show monthly figures
| Month | MWh |
|---|---|
| April 2021 | 79.7 |
| May 2021 | 70.0 |
| June 2021 | 57.5 |
| July 2021 | 58.9 |
| August 2021 | 68.2 |
| September 2021 | 37.1 |
| October 2021 | 31.0 |
| November 2021 | 22.4 |
| December 2021 | 10.6 |
| January 2022 | 32.6 |
| February 2022 | 33.1 |
| March 2022 | 24.3 |
| Total | 525.3 |
2Part 2 of 2
Setting a science-based target
We are using our verified baseline to set an emissions reduction target in line with limiting global warming to 1.5 °C.
Why a science-based target
The Science Based Targets initiative (SBTi) assesses company targets against the emission cuts that climate science says are needed to keep warming to 1.5 °C. Setting our target through the SBTi gives customers, programme partners and investors an independent benchmark to check our progress against.
The target we are preparing
Reduce absolute Scope 1 and 2 GHG emissions 37.8% by 2030 from a FY 2021-22 base year, and measure and reduce our Scope 3 emissions.
We intend to submit this near-term target to the SBTi for validation. It has not yet been validated by the SBTi.
Scope 1 and 2 emissions, tCO2e
Base year and target; the line shows a straight-line pathway between them
Grid electricity is our only Scope 1 and 2 source today, so renewable power and lower energy use per tonne are the main levers for this target.
How we plan to reduce emissions
Each lever is matched to the part of our base-year footprint it acts on. Near-term levers target electricity and freight; medium-term levers tackle the materials that make up most of our footprint.
Near termElectricity and freight
Rooftop solar, green open access power or renewable energy certificates.
Servo-hydraulic or all-electric moulding machines, barrel insulation, chiller optimisation and a compressed-air leak programme.
Plan imports and export orders early enough to ship by sea, cutting each tonne's freight emissions by about 95%.
Medium termMaterials
More recycled HDPE where WHO PQS performance allows, mass-balance or bio-attributed resin, and product carbon footprints from resin suppliers.
Bio-based polyols, optimised foam density and wall thickness, and low-GWP blowing agents, all validated against cold life.
Right-sized cartons, recycled-content board and thinner polybags.
Long termProduct end of life
Design for disassembly and mono-material recovery, and take-back pilots with programme buyers.
- Acts on Scope 2 (electricity)
- Acts on Scope 3 (value chain)
Bars show the share of our FY 2021-22 footprint each lever acts on, not the reduction it will deliver. Renewable electricity and process efficiency act on the same electricity emissions.
Our roadmap
-
1
Measure
Scope 1, 2 and 3 base-year inventory for FY 2021-22 under the GHG Protocol.
Complete -
2
Verify
Inventory independently verified to ISO 14064-3, to be repeated each year on the same boundary.
Complete -
3
Refine
Supplier carbon footprints for HDPE, polyol and MDI, carrier freight data, and the three pending Scope 3 categories.
Next -
4
Set the target
Submit our near-term target to the SBTi for validation.
Planned -
5
Report progress
Publish verified emissions against our base year every year, aligned with BRSR Core.
Planned
- Scope 1 is reported as nil for FY 2021-22. The PU foam blowing agent is being confirmed, because an HFC blowing agent would add direct emissions.
- Capital goods (Category 2), fuel- and energy-related activities (Category 3) and end-of-life of sold products (Category 12) are pending data or method and are not included in the total. Categories 4, 5 and 9 are provisional. The remaining six categories are not applicable or are covered in Scope 2.
- Scope 2 is calculated on a location-based method using the national grid factor. Figures are in tonnes of CO2-equivalent; totals may not add because of rounding.
- Source: Blow Kings Corporate GHG Inventory FY 2021-22 (BK-GHG-FY22, Rev 3.3, issued October 2026), prepared by EnviroWealth and independently verified to ISO 14064-3.
- References to the Science Based Targets initiative describe our intention to submit a target for validation. They do not imply endorsement, approval or validation by the SBTi.
The full FY 2021-22 GHG inventory report is available on request.